Do you live behind a Levee?
The Hinton sector comprises of Hinton, Wallalong, Duns Creek, Butterwick, Iona, Woodville, Swan Reach, Osterley, Brandy Hill and Nelson Plains. The township of Hinton is situated on the Paterson River, near to the confluence of the Hunter and Paterson Rivers. Flood risk within the sector stretches from the floodplain from Vacy, near to the confluence of the Allyn and Paterson Rivers to the confluence of the Hunter and Paterson at Hinton, at which the Hunter can influence the severity of flooding within the Paterson River, assuming that coincident flooding is occurring.
Yes, you are!
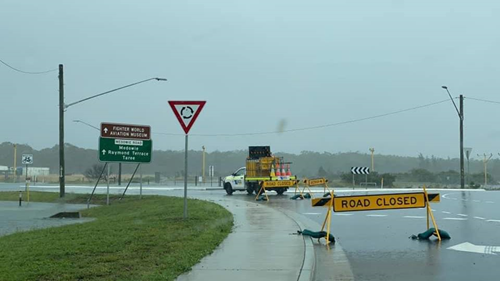
Isolation of Hinton and rural area can occur in events, which may last for periods of several days, most recently occurring in March 2022.
Access to Woodville can also be cut from all three incoming roads, this occurs due to localised flooding and riverine flooding within the area, this occurred in July 2022 and rendered Woodville isolated for several days.
In the February 1955 event, Hinton reached a level of 7.36m which is estimated at being greater than the 1% AEP (Annual chance of occurring) level. The township was isolated in 1988 for a period of 8 days, which occurred again in the June 2007 event. In July 2022, Hinton again experienced prolonged isolation and low-lying inundation.
To understand what happens in a Hinton flood, it is important that all residents and businesses know:
The Bureau of Meteorology (BoM) reads and refers to the Hinton Bridge gauge (210410).
|
Height (m) |
Relevance / Action |
|
7.36m |
Peak Height February 1955 |
|
6.40m |
Major Flood Height |
|
6.20m |
Moderate Flood Height |
|
5.87m |
August 1998 Peak Height |
|
5.83m |
Peak Height July 2022 |
|
5.80m |
Minor Flood Height |
The Raymond Terrace Sector covers the town of Raymond Terrace, Lakeside Village, Heatherbrae and the nearby rural areas of Motto Farm, area in the Port Stephens Local Government area.
Yes, you are!
The Raymond Terrace area may experience floods either due to the Hunter River and Williams River overtopping its banks (and levees), tidal inundation or by excessive rainfall over the local catchment area, or a combination of these mechanisms. Floods due to the Hunter River have been well recorded.
To understand what happens in a Williams River flood, it is important that all residents and businesses know:
The Bureau of Meteorology reads and refers to Raymond Terrace gauge (210452).
RAYMOND TERRACE GAUGE
|
Height (m) |
Relevance / Action |
|
9.94m |
Peak Height November 2021 |
|
4.97m |
Peak Height February 1955 |
|
4.86m |
Estimated 1% AEP (1:100 years) |
|
3.75m |
Peak Height December 1974 |
|
3.50m |
Major Flood Height |
|
3.12m |
Estimated 5% AEP (1:20 years) |
|
3.10m |
Moderate Flood Level |
|
3.05m |
Peak Height 22 April 2015 |
|
2.50m |
Minor Flood Level |
The Medowie area can be impacted by two catchments, relatively equal in area: Campvale Swamp to the West and Moffats Swamp to the East. These catchments are generally separate, except in extreme events where Moffats Swamp can flow into Campvale Swamp over Medowie Road. Complications exist within the catchments, as Campvale catchment is a water drinking supply and so drainage solutions account for water quality impacts.
Yes, you are!
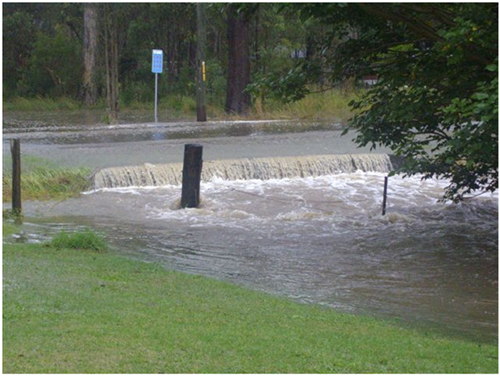
Campvale Swamp has exhibited two main flooding related issues, upstream of Ferodale Road have been subjected to short duration flooding and Downstream to Ferodale Road, flooding can occur for prolonged periods causing agricultural issues.
Moffats Swamp runs through Medowie’s State Forest and down to the Southern Boundary at Richardson Road. The primary risk for flooding with reference to this catchment is the flowing of water travelling to the swamp through neighbouring properties and streets.
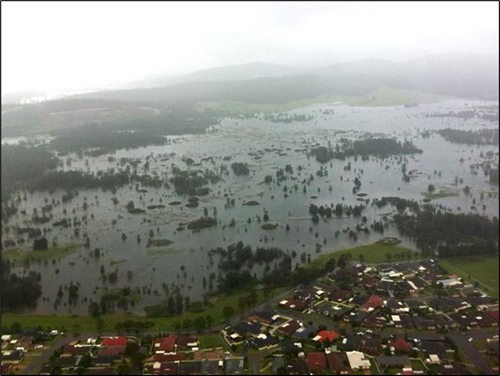
Recently, flooding events have occurred in 2006, 2007, 2008, 2009 and 2013. Most serious of which, the June 2007 saw the catchments experience large rain totals which saw several properties experience over floor flooding near to the Campvale Swamp. Flooding events regularly do impact roads and passageways, which enter and exit Medowie.
To understand what happens in a Medowie flood, it is important that all residents and businesses know:
The villages of Seaham, East Seaham intervening rural areas of the Port Stephens LGA. It also borders Clarence town in Dungog Local Council. Clarence Town, Seaham, and East Seaham are situated on the Williams River and Jackass Creek, all within 32 km from Raymond Terrace. The Williams River has a major tributary, in that of the Chichester River, which has steep slopes of 5-25% influencing the flow velocity. Seaham Weir has been constructed to limit tidal influence as well as backflow from the Hunter River.
Yes, you are!
The sector can be isolated for periods of up to 5 days dependent on the scale of the respective flood.
The Williams River has a long history of flooding, independent or co-dependent to a Hunter River Flood. Flood’s in March 1963 and February 1990 were independent floods on the Williams catchment, whilst the February 1955 flood caused a major flood on the Hunter River and a major flood on the Lower Williams.
To understand what happens in a Williams River flood, it is important that all residents and businesses know:
The Bureau of Meteorology (BoM) reads and refers to the Mill Dam Falls (Glen Martin) gauge (210010) and Seaham (561087)
Mill Dam Falls (Glen Martin) gauge
|
Height (m) |
Relevance / Action |
|
11.79m |
Peak Height February 1990 |
|
10.02m |
Peak Height June 2007 |
|
9.10m |
Major Flood Height |
|
8.08m |
Peak Height April 2008 |
|
7.60m |
Moderate Flood Height |
|
7.30m |
Peak Height September 2008 |
|
6.10m |
Minor Flood Height |
Seaham (561087) Heights unclassified
|
Height (m) |
Relevance / Action |
|
|
Peak Height June 2007 |
|
|
|
|
|
|
The Williamstown sector also includes Tomago and Salt Ash. The sector is located adjacent to the lower reaches of the Hunter River, with one of its tributaries, Tilligerry Creek, approximately 11km upstream of the Hunter River Mouth at Newcastle.
Yes, you are!
Flooding in the Williamtown / Salt Ash area is primarily caused by flooding due to local runoff, flooding due to backwater effects of flooding in the Hunter River or elevated ocean tide, which may include overtopping of the levee system surrounding Fullerton Cove; and flooding due to backwater effects of flooding in Port Stephens, which may include overtopping of the levee system at Salt Ash. The dominant for the Williamtown / Salt Ash locality is mainstream Hunter River flooding. Under these conditions, Hunter River flooding results in Fullerton Cove filling and discharging into the Tilligerry Creek floodplain, under cross drainage structures and through overtopping of Nelson Bay Road and some properties around the Newcastle Airport.
Flooding along the Hunter River is well documented, though Tilligery Creek has not been as well documented. A large runoff event occurred in 1990 in which the area recorded over 450mm rain within a 72-hour period. Significant flooding events also occurred in April 2015 and January 2018, with the most significant being the 1955 event.
To understand what happens in a Williamtown flood, it is important that all residents and businesses know:
The Bureau of Meteorology reads and refers to the Hexham Bridge gauge (210448) and the Raymond Terrace gauge (210452).
HEXHAM BRIDGE GAUGE
|
Height (m) |
Relevance / Action |
|
4.10m |
Peak Height February 1955 |
|
3.80m |
Major Flood Level |
|
2.90m |
Moderate Flood Level |
|
2.30m |
Estimated 5% AEP (1:20 years) |
|
1.90m |
Minor Flood Level |
|
1.88m |
Peak Height June 2020 |
RAYMOND TERRACE GAUGE
|
Height (m) |
Relevance / Action |
|
9.94m |
Peak Height November 2021 |
|
4.97m |
Peak Height February 1955 |
|
4.86m |
Estimated 1% AEP (1:100 years) |
|
3.75m |
Peak Height December 1974 |
|
3.50m |
Major Flood Height |
|
3.12m |
Estimated 5% AEP (1:20 years) |
|
3.10m |
Moderate Flood Level |
|
3.05m |
Peak Height 22 April 2015 |
|
2.50m |
Minor Flood Level |